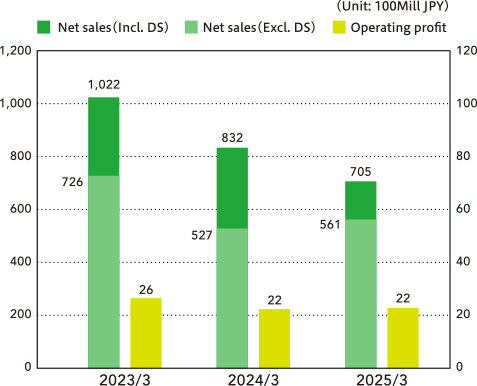
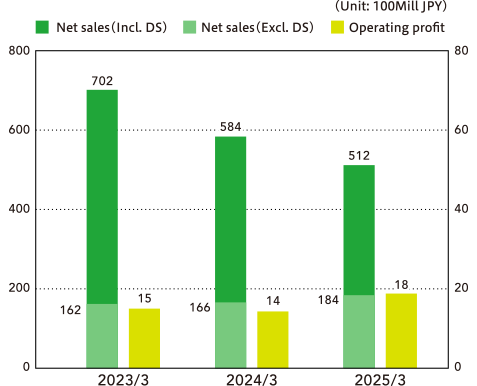
Major management indicators
-
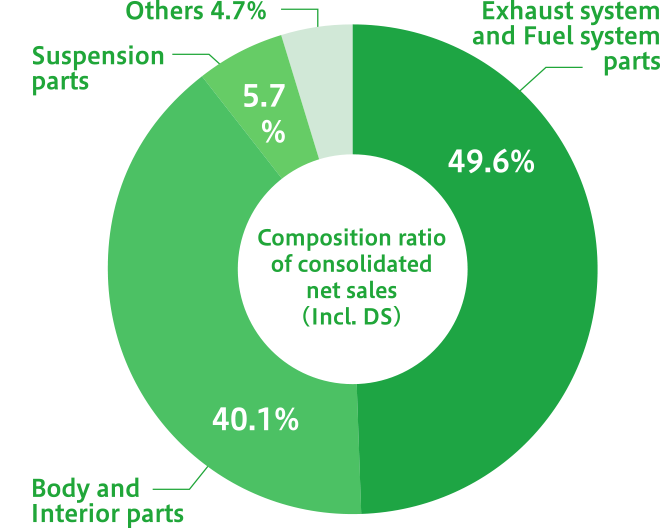
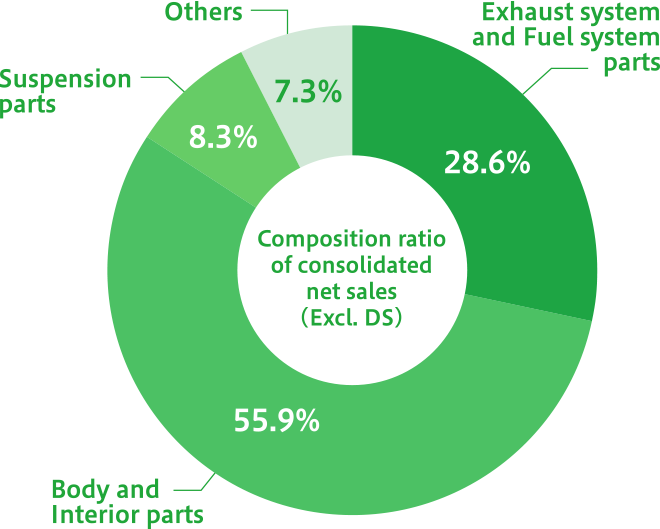
DS Parts...
Direct Supply Parts.
It is the Parts Supplied by customers.
The selling price including DS parts includes values of parts supplied by customers.
No Profit Impact.
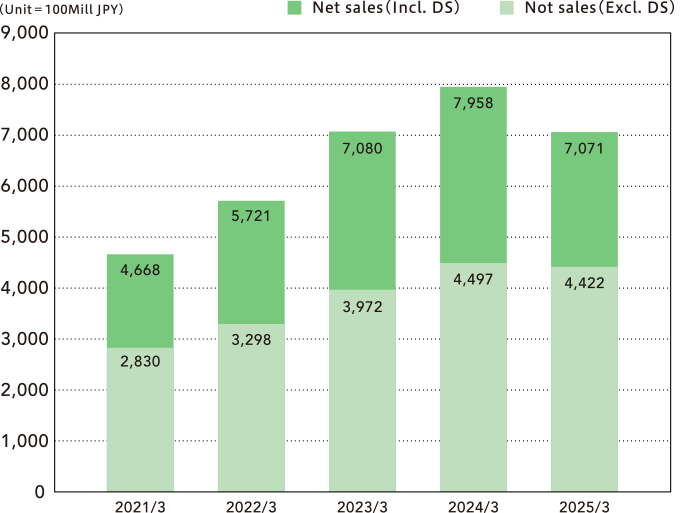
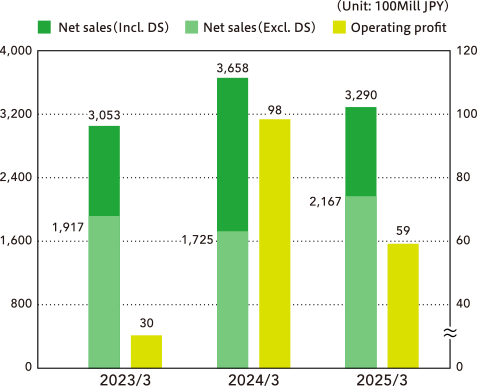
Net Sales
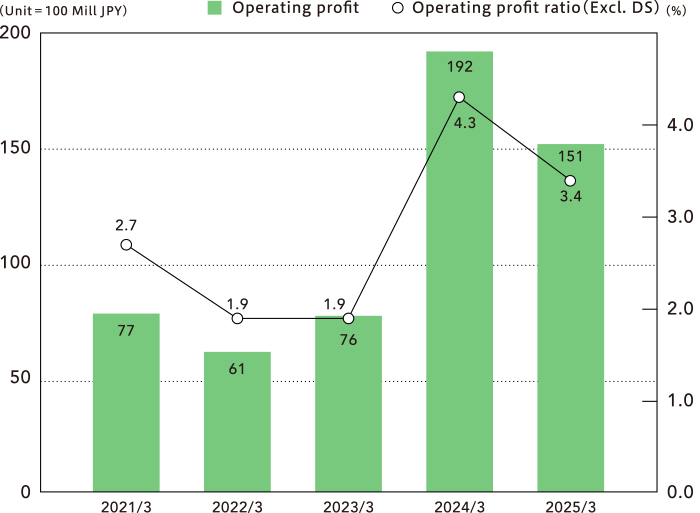
Operating profit / Operating profit ratio
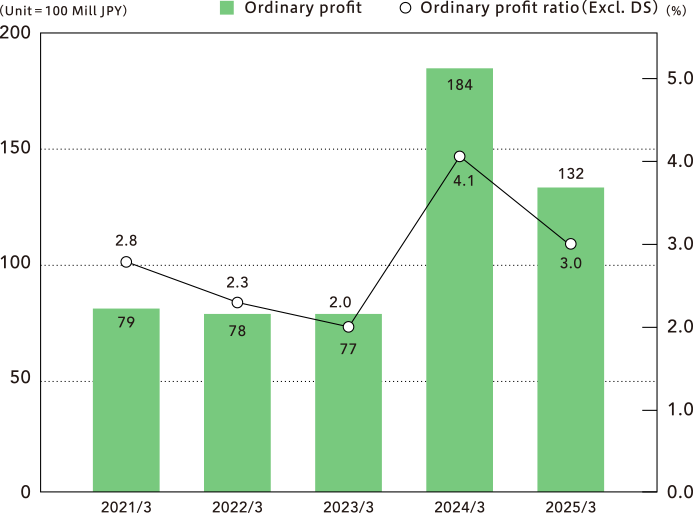
Ordinary profit / Ordinary profit ratio
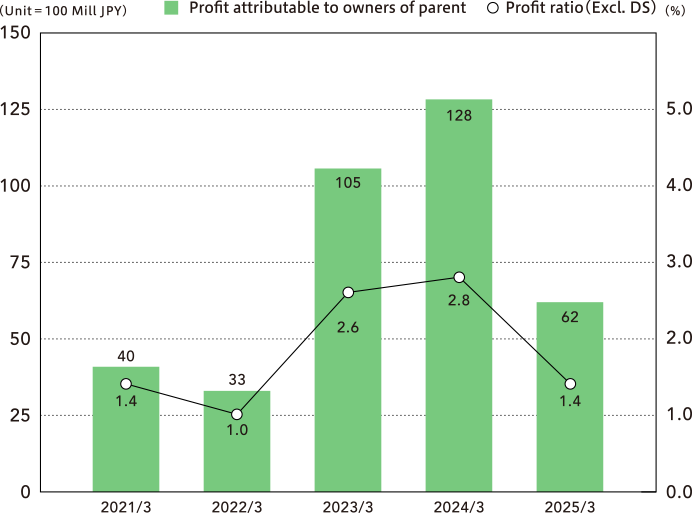
Profit attributable to owners of parent / Profit ratio
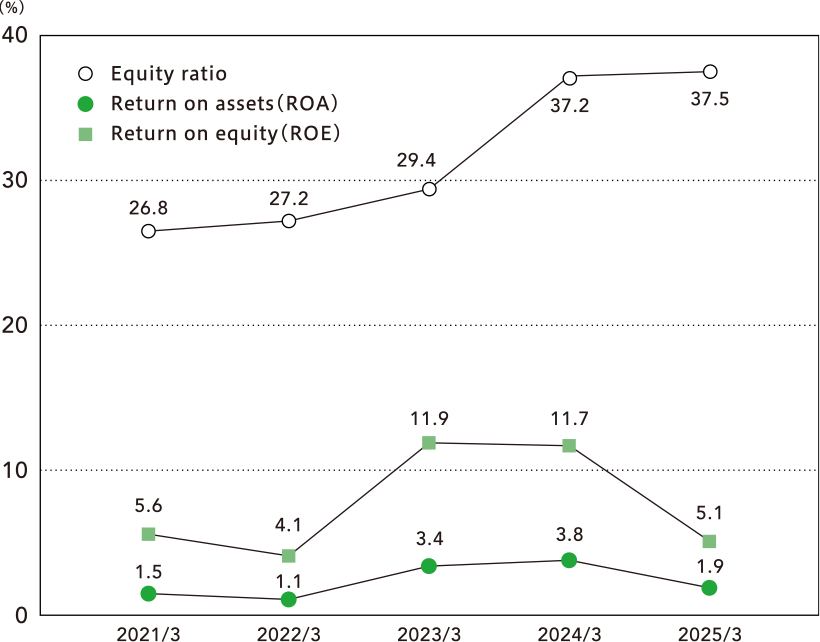
Consolidated financial performance
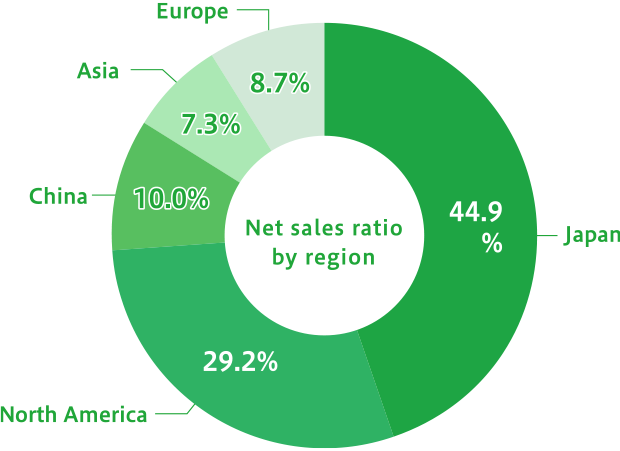
Information by regional segment
-
Japan
-
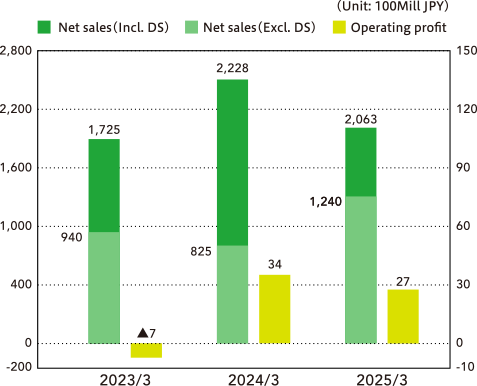
North America
-
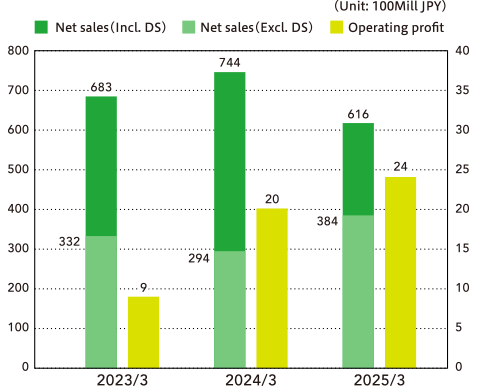
Europe
-
China
-
Asia
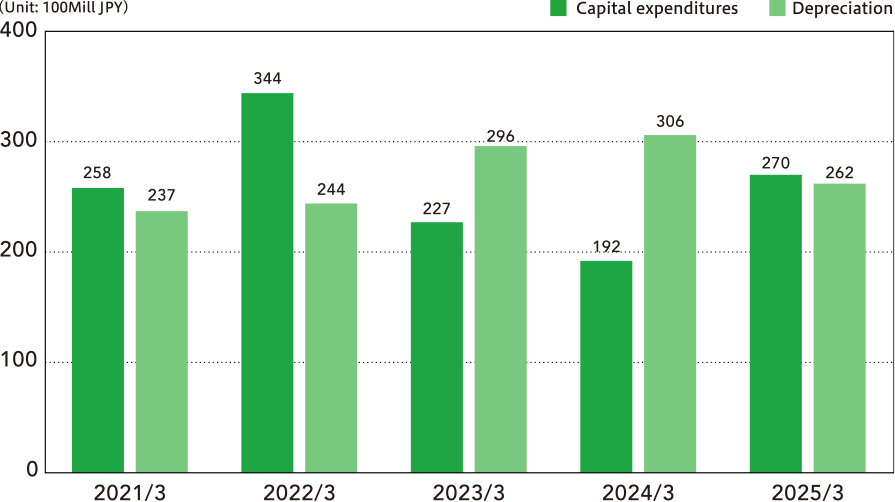
Capital expenditures and depreciation
Composition ratio of consolidated net sales